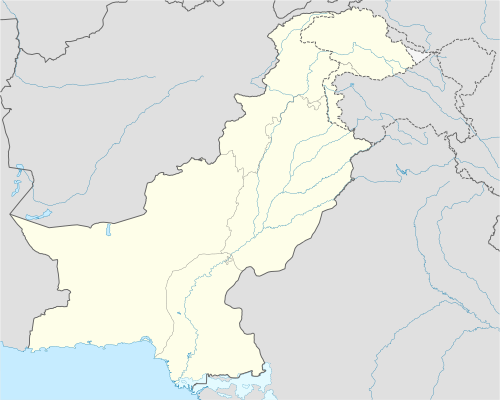
Chhor, Sindh
Pakistani town From Wikipedia, the free encyclopedia
Chhor (Sindhi: ڇور) is a town situated in Umerkot District, Sindh, Pakistan. It has an altitude of 4 metres (13 ft).[1] It lies on the Mirpur Khas-Jodhpur railway line. Umarkot is to the west, Sanghar to the north, Khokharapar to the east and Badin and Mithi Districts to the south. It is start of Thar Desert which further touches the Indian border to the east. The Pakistan Army school of desert warfare is located here.[2]
This article has multiple issues. Please help improve it or discuss these issues on the talk page. (Learn how and when to remove these messages)
|
Chhor ڇور | |
|---|---|
| Coordinates: 25°3′40″N 69°46′57″E / 25.06111; 69.78250][[Category:Pages using gadget WikiMiniAtlas]]"},"html":"Coordinates: </templatestyles>\"}' data-mw='{\"name\":\"templatestyles\",\"attrs\":{\"src\":\"Module:Coordinates/styles.css\"},\"body\":{\"extsrc\":\"\"}}'/>25°3′40″N 69°46′57″E / 25.06111°N 69.78250°E"}"> | |
| Country | Pakistan |
| Province | Sindh Province |
| Elevation | 4 m (13 ft) |
| Population (2023) | |
• Total | 21,178 |
| Time zone | UTC+5 (PST) |
Demographics
| Census | Population[3] |
|---|---|
| 1998 | 13,981 |
| 2017 | 19,930 |
| 2023 | 21,178 |
Climate
Summarize
Perspective
Chhor has a hot desert climate (Köppen climate classification BWh) with very hot summers and warm winters. The main rainfall is in the monsoon season, which lasts from June to September.
| Climate data for Chhor (1991–2020, extremes 1957–present) | |||||||||||||
|---|---|---|---|---|---|---|---|---|---|---|---|---|---|
| Month | Jan | Feb | Mar | Apr | May | Jun | Jul | Aug | Sep | Oct | Nov | Dec | Year |
| Record high °C (°F) | 34.0 (93.2) |
37.7 (99.9) |
45.2 (113.4) |
49.0 (120.2) |
49.4 (120.9) |
52.0 (125.6) |
46.4 (115.5) |
43.0 (109.4) |
44.0 (111.2) |
44.0 (111.2) |
40.0 (104.0) |
35.5 (95.9) |
52.0 (125.6) |
| Mean daily maximum °C (°F) | 26.8 (80.2) |
30.2 (86.4) |
35.4 (95.7) |
40.3 (104.5) |
42.2 (108.0) |
40.8 (105.4) |
37.3 (99.1) |
35.4 (95.7) |
36.2 (97.2) |
37.7 (99.9) |
33.6 (92.5) |
28.9 (84.0) |
35.4 (95.7) |
| Daily mean °C (°F) | 16.7 (62.1) |
20.0 (68.0) |
25.5 (77.9) |
30.6 (87.1) |
33.8 (92.8) |
33.9 (93.0) |
31.9 (89.4) |
30.5 (86.9) |
30.2 (86.4) |
28.7 (83.7) |
23.2 (73.8) |
18.3 (64.9) |
26.9 (80.4) |
| Mean daily minimum °C (°F) | 6.5 (43.7) |
9.7 (49.5) |
15.5 (59.9) |
21.0 (69.8) |
25.2 (77.4) |
27.1 (80.8) |
26.7 (80.1) |
25.5 (77.9) |
24.2 (75.6) |
19.6 (67.3) |
12.7 (54.9) |
7.7 (45.9) |
18.5 (65.3) |
| Record low °C (°F) | −2.8 (27.0) |
−2.0 (28.4) |
−1.6 (29.1) |
9.0 (48.2) |
11.8 (53.2) |
20.0 (68.0) |
19.5 (67.1) |
19.5 (67.1) |
17.5 (63.5) |
8.8 (47.8) |
1.1 (34.0) |
−3.3 (26.1) |
−3.3 (26.1) |
| Average precipitation mm (inches) | 1.2 (0.05) |
4.6 (0.18) |
2.0 (0.08) |
2.2 (0.09) |
4.5 (0.18) |
19.3 (0.76) |
70.5 (2.78) |
75.6 (2.98) |
59.1 (2.33) |
9.0 (0.35) |
1.0 (0.04) |
1.2 (0.05) |
250.2 (9.85) |
| Average precipitation days (≥ 1.0 mm) | 0.4 | 0.5 | 0.4 | 0.4 | 0.1 | 1.6 | 4.0 | 4.7 | 2.5 | 0.4 | 0.2 | 0.3 | 15.5 |
| Average relative humidity (%) | 46 | 46 | 43 | 41 | 46 | 56 | 66 | 69 | 63 | 50 | 47 | 49 | 52 |
| Source 1: NOAA[4][5] | |||||||||||||
| Source 2: (extremes),[6] Deutscher Wetterdienst (humidity 1961-1995)[7] | |||||||||||||
References
Wikiwand - on
Seamless Wikipedia browsing. On steroids.
