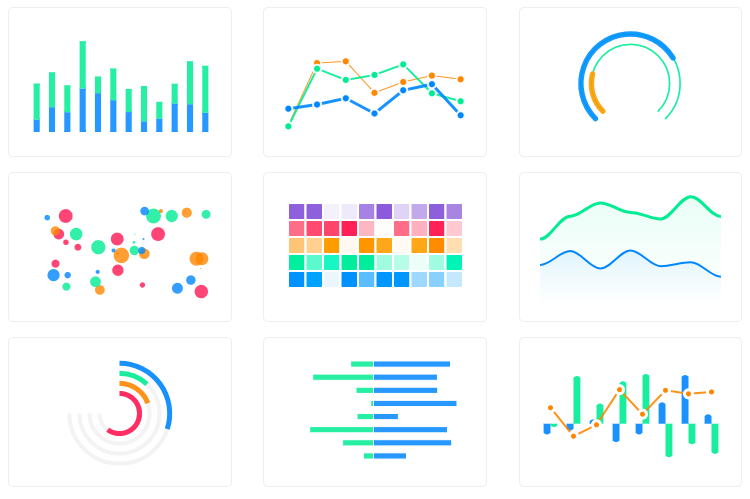
Stencil.js wrapper for ApexCharts to build interactive visualizations in stencil.
- Put a script tag similar to this
<script src='https://unpkg.com/stencil-apexcharts/dist/apex.js'></script>in the head of yourindex.html - Then you can use the element anywhere in your template, JSX, html etc.
- Run
npm install stencil-apexcharts apexcharts --save - Put a script tag similar to this
<script src='node_modules/stencil-apexcharts/dist/apex.js'></script>in the head of yourindex.html - Then you can use the element anywhere in your template, JSX, html etc.
npm install stencil-apexcharts apexcharts --saveimport stencil-apexcharts;<apex-chart
type="bar"
series={[{
name: 'sales',
data: [30, 40, 35, 50, 49, 60, 70, 91, 125]
}]}
options={{
xaxis: {
categories: [1991, 1992, 1993, 1994, 1995, 1996, 1997, 1998, 1999]
}
}} /><apex-chart></apex-chart>
<script>
const chart = document.querySelector('apex-chart');
chart.series = [
{
name: 'sales',
data: [30, 40, 35, 50, 49, 60, 70, 91, 125]
}
];
chart.options = {
xaxis: {
categories: [1991, 1992, 1993, 1994, 1995, 1996, 1997, 1998, 1999]
}
};
</script>Simple! Just change the series or options and it will automatically re-render the chart.
| Property | Attribute | Description | Type | Default |
|---|---|---|---|---|
height |
height |
Can be 100% or 300px or 300 |
number | string |
undefined |
options |
-- | The configuration object API (Reference) | ApexOptions |
undefined |
series |
-- | The series API (Reference) | number[] | { name: string; data: number[] | { x: string; y: number; }[]; }[] |
undefined |
type |
type |
Chart type API (Reference) | "area" | "bar" | "bubble" | "candlestick" | "donut" | "heatmap" | "histogram" | "line" | "pie" | "radar" | "radialBar" | "scatter" |
undefined |
width |
width |
Can be 100% or 400px or 400 |
number | string |
undefined |
npm install
npm install apexchartsBasic example is included to show how to get started using ApexCharts with Stencil easily.
To run the examples,
npm install
npm install apexcharts
npm run startnpm run buildStencil-ApexCharts is released under MIT license. You are free to use, modify and distribute this software, as long as the copyright header is left intact.


