8000 GitHub - htnani/iSEE: R/shiny interface for interactive visualization of data in objects derived from the SummarizedExperiment class
[go: up one dir, main page]
More Web Proxy on the site http://driver.im/
Skip to content
/ iSEE Public
forked from iSEE/iSEE

R/shiny interface for interactive visualization of data in objects derived from the SummarizedExperiment class

License

Notifications You must be signed in to change notification settings

htnani/iSEE


Folders and files

NameName
Last commit message
Last commit date

Latest commit


Repository files navigation

iSEE - The interactive SummarizedExperiment Explorer

Software status

Platforms OS R CMD check Coverage
Travis CI Linux Travis CI build status Codecov.io coverage status
Bioc (devel) Multiple Bioconductor-devel Build Status NA
Bioc (release) Multiple Bioconductor-release Build Status NA

Overview

The iSEE package provides an interactive user interface for exploring data in objects derived from the SummarizedExperiment class. Particular focus is given to single-cell data stored in the SingleCellExperiment derived class. The user interface is implemented with RStudio's Shiny, with a multi-panel setup for ease of navigation.

This initiative was proposed at the European Bioconductor Meeting in Cambridge, 2017. Current contributors include:

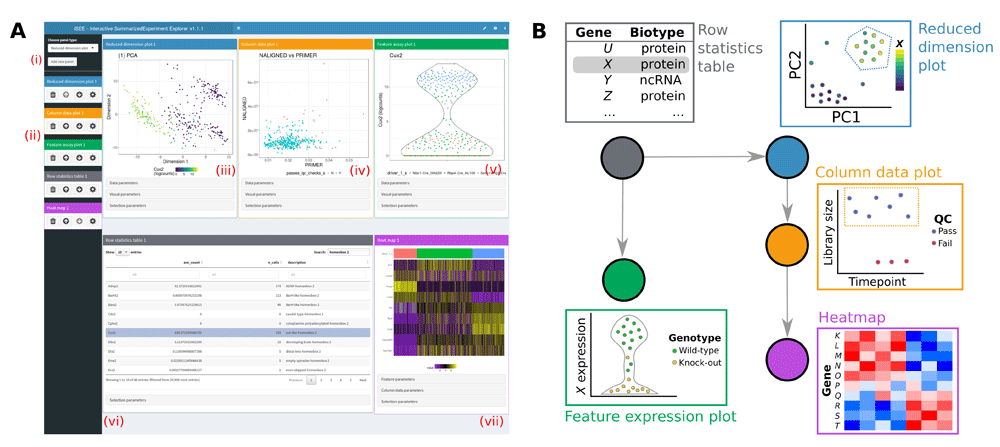
Figure 1. iSEE uses a customisable multi-panel layout.

Functionalities

The user interface of iSEE web-applications currently offers the following features:

✅ Multiple interactive plot types with selectable points.

✅ Interactive tables with selectable rows.

✅ Coloring of samples and features by metadata or expression data.

✅ Zooming to a plot subregion.

✅ Transmission of point selections between panels to highlight, color, or restrict data points in the receiving panel(s).

✅ Lasso point selection to define complex shapes.

Sample-level visualization

The iSEE user interface currently contains the following components where each data point represents a single biological sample:

Reduced dimension plot: Scatter plot of reduced dimensionality data.

Column data plot: Adaptive plot of any one or two sample metadata. A scatter, violin, or square design is dynamically applied according to the continuous or discrete nature of the metadata.

Feature assay plot: Adaptive plot of expression data across samples for any two features or one feature against one sample metadata.

Column statistics table: Table of sample metadata.
Feature-level visualization

The iSEE user interface currently contains the following components where each data point represents a genomic feature:

Row data plot: Adaptive plot of any two feature metadata. A scatter, violin, or square design is dynamically applied according to the continuous or discrete nature of the metadata.

Sample assay plot: Adaptive plot of expression data across features for any two samples or one sample against one feature metadata.

Row statistics table: Table of feature metadata.

Integrated visualization

The iSEE user interface contains the following components that integrate sample and feature information:

Heat map plot: Visualize multiple features across multiple samples annotated with sample metadata.

Custom panels

The iSEE user interface allows users to programmatically define their own plotting and table panels.

Custom data plot: Plotting panel that can be assigned any user-defined function returning a ggplot object.

Custom statistics table: Table panel that can be assigned any user-defined function returning a data.frame object.

Miscellaneous

✅ The iSEE user interface continually tracks the code corresponding to all visible plotting panels. This code is rendered in a shinyAce text editor and can be copy-pasted into R scripts for customization and further use.

Want to try iSEE?

We set up instances of iSEE applications running on diverse types of datasets at those addresses:

Please keep in mind that those public instances are for trial purposes only; yet they demonstrate how you or your system administrator can setup iSEE for analyzing or sharing your precomputed SummarizedExperiment/SingleCellExperiment object.

About

R/shiny interface for interactive visualization of data in objects derived from the SummarizedExperiment class

Resources

License

Stars

Watchers

Forks

Packages

No packages published

Languages

  • R 99.8%
  • Other 0.2%
0