This package allows you to install Grafana quickly and simply on a YunoHost server. If you don't have YunoHost, please consult the guide to learn how to install it.
Metric & analytic dashboards for monitoring
Shipped version: 9.3.2~ynh1
Demo: https://play.grafana.org
- This is a fork from the official Grafana setup for YUNoHost
- This Grafana setup ships standalone, without any datasource pre-installed. You'll have to setup one, for instance Prometheus, InfluxDB or Netdata.
- Install Prometheus with YUNoHost
- Install the node-exporter package
sudo apt install prometheus-node-exporter - Configure Prometheus to Scrap the node exporter, by adding the following snippet under the prometheus config, then restart prometheus.
# /opt/yunohost/prometheus/prometheus.yml
# ...
scrape_configs:
  # Keep the prometheus job...
  - job_name: 'node_exporter'
    static_configs:
- targets: ['localhost:9100']- Add Prometheus as a datasource on Grafana. Be careful that if you have added
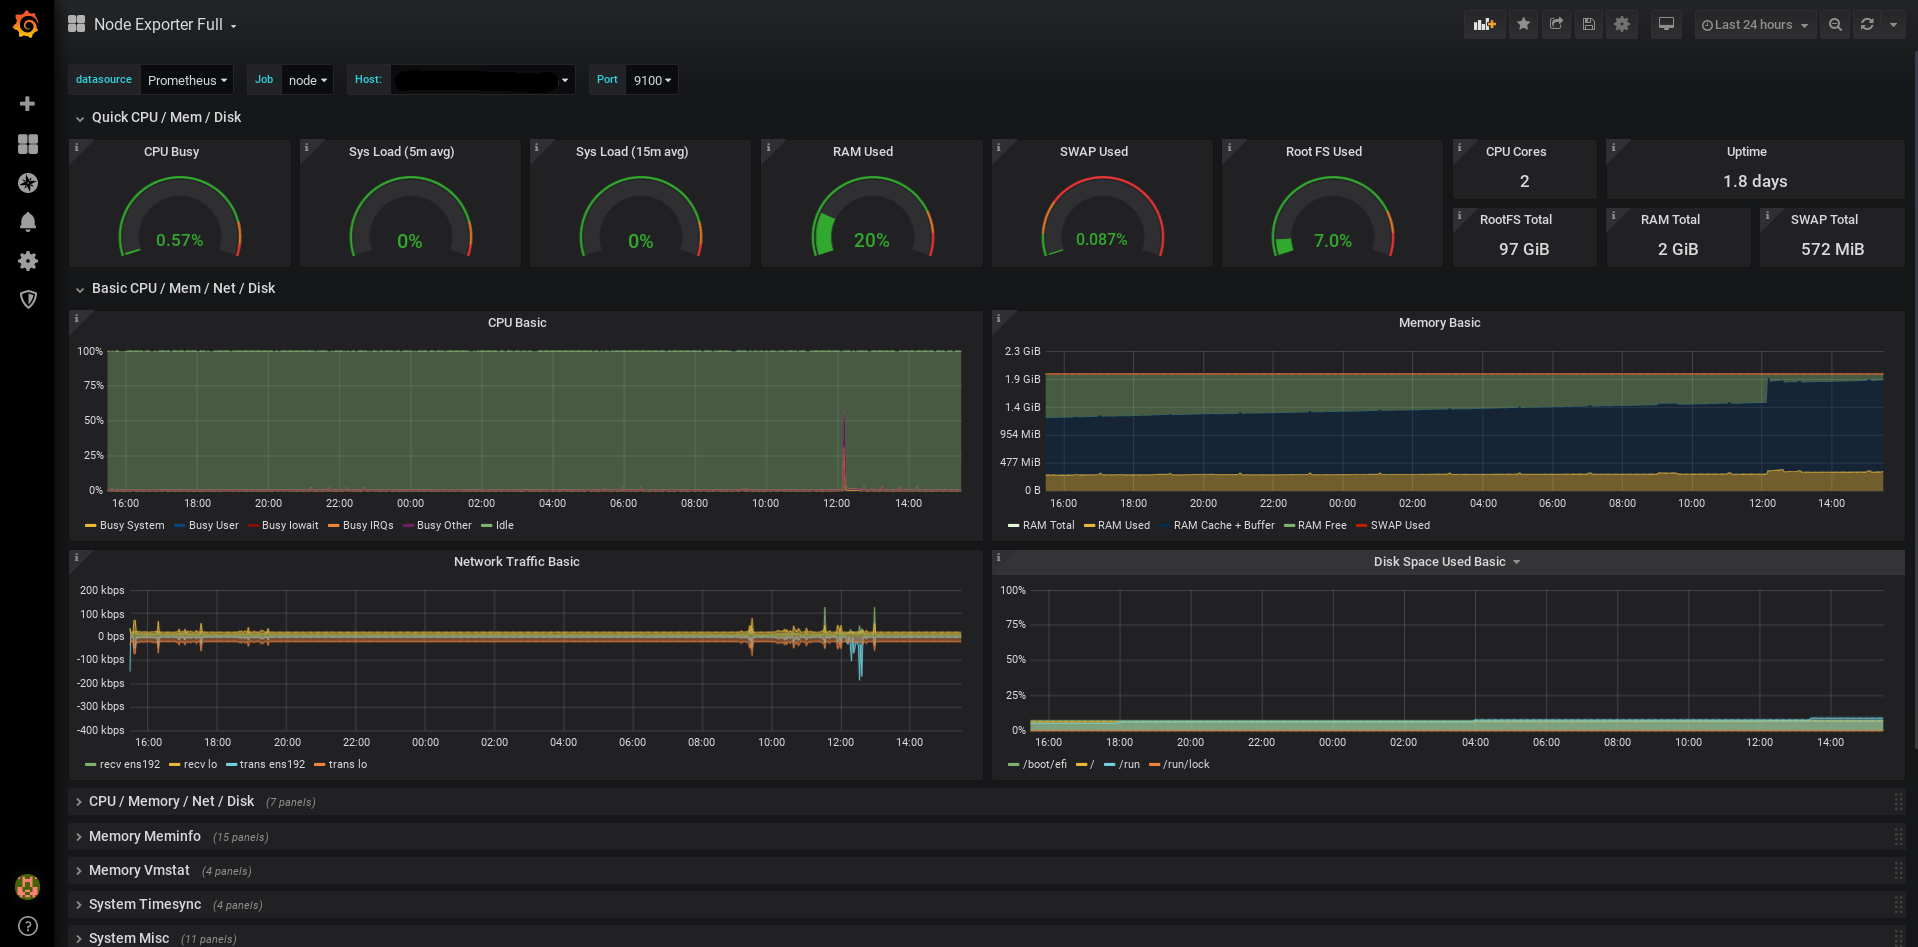
Prometheuson a non root path of a domain, you'll need to use this path the datasource URL too. For instance the datasource prometheus address ishttp://localhost:9100/prometheusbecause Prometheus is installed undermyserver.com/prometheus. - You can now install an dashboard to view exported metrics, we recommend the excellent Node Exporter Full dashboard.
- You can also define alerts on Grafana.
- Official Grafana documentation: https://grafana.com/docs/grafana/latest/
- installs Grafana as dashboard server
LDAP and HTTP auth are supported.
- The default dashboard may be updated in a further release of this package, so please make sure you create your own dashboards!
- Organizations creation doesn't play well with LDAP integration; it is disabled for standard users, but can't be disabled for administrators: please do not create organizations!
- Official app website: https://grafana.com/
- Upstream app code repository: https://github.com/grafana/grafana
- Report a bug: https://github.com/jlevesy/grafana_standalone_ynh/issues
Please send your pull request to the testing branch.
To try the testing branch, please proceed like that.
sudo yunohost app install https://github.com/jlevesy/grafana_standalone_ynh/tree/testing --debug
or
sudo yunohost app upgrade grafana -u https://github.com/jlevesy/grafana_standalone_ynh/tree/testing --debug
More info regarding app packaging: https://yunohost.org/packaging_apps