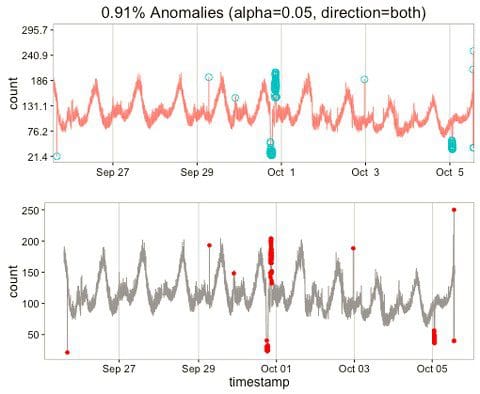
In data analysis, anomaly detection is one of the widely used techniques for data classification. These algorithms are used in variety of applications such as network intrusion detection, Health monitoring, Asset Management and predictive maintenance and many more. With focus on production line sensor data, and depending on the level of automation involved in the line, anomaly detection can be as simple as implementation of a conditional logic that monitors deviation from setpoints. However, most of the time and when dealing with more sophisticated production lines, failures may arise from contribution of multiple behaviours which might not necessarily lead to an alarm. In such occasions, recognizing patterns leading into such anomalies can prevent failures from occurance. In this repository we will be reviewing a case study of a finctional production line and random anomalies that can happen within certain cycles.
Pattern A:We consider pattern A to be our production cycle pattern. For simplicity, peak points of the patterns are stored in a list with time segments in minutes stored in corresponding dictionary. Think about this pattern as a signal that indicates a production cycle (e.g. Pressure in mold cavity).
Pattern B,C,D:These patterns represent other behaviours during production time that might not necessarily represent a production cycle. For instance, purging the machine or start-up or etc. The values stored in Segment dictionary are the X axis values which in our case is the 10th of a minute. Therefore, if the maximum value in segment['A'] is 6, this means that the corresponding cycle takes: 6 x 10 x 60 = 3600 seconds.
We will be generating a random production schedule that is logged second-by-second. Any scenario of A, B, C or D can happen throughout the day and they are randomly distributed across the schedule. For convenience, we have labelled any production timestamp as a 0 or 1 representing whether we are making a part or not. This label is only for training purposes and will not be used for anomaly detection. Our assumption is that our system does not have a particular tag representing production/no production trends in the log.
Depending on our production cycle, different sensor data is stored in a separate folder. We have allocated a chance of 40% for anomalies that might occur during day and the daily logs are populated accordingly with this probability.
Subsequently, once the daily log is generated, the data is stored in corresponding folders of Cycle and Sensor as a .CSV file.
A deep neural network architecture is being developed across equal samplese of Production/No-Prdouction data in order to distinguish between the cycle times where Pattern A has been repeated against the cycle times where other patterns are occuring. The deep neural network architecture in this example uses one-dimensional Convolutional Neural Network as a proof of concept. Other Deep learning networks such as LSTM could also be utilized.
Once the model is generated, random days are broken into sliding windows shifting with a resolution size and the window of our interest is being fed into our Cycle_Detector model. For fine resolutions, typically the model predicts high probabilities on adjacent timestamps. To avoid overfitting in this scenario, we used an argmax functionality where the probability peaks are being determined as the output of the model. The cycle times are exported via RESTFUL API to other endpoints in use.
