A Kubernetes-native collector for monitoring noisy neighbor issues, currently focusing on memory subsystem interference between pods. This project is under active development and we welcome contributors to help build this critical observability component.
The Noisy Neighbor Collector helps SREs identify and quantify performance degradation caused by memory subsystem interference ("noisy neighbors").
This data helps operators:
- Quantify the performance impact of noisy neighbors
- Determine which pods are causing interference and which are affected
- Mitigate interference by isolating high-noise deployments and working with their owners to optimize them
Memory noisy neighbors directly impact application latency, especially at the tail (P95/P99). For example, Google published 5x-14x increases in P95/P99 latency due to memory subsystem interference.
Collecting noisy neighbor metrics and reducing tail latency delivers two key benefits:
-
Better response times for users, improving customer experience and key business metrics. Latency has a direct impact on revenue.
-
More efficient infrastructure through reduced autoscaling. Many scaling decisions are based on P95/P99 metrics. By reducing spikes caused by noisy neighbors, you can run at higher utilization without breaching latency SLOs.
Common sources of interference include:
- Garbage collection
- Large transactions (e.g. scanning many database records)
- Analytics workloads
The collector is designed with security in mind and has a limited scope of data collection:
Only collects CPU profiling data and process metadata:
- Performance counters: cycles, instructions, LLC cache misses
- Process metadata: process name, process ID (pid), cgroup/container ID
Does not access process internals or user data:
- No application-level data is accessed or collected
You can review our data schema and sample data files to see exactly what is collected. These resources demonstrate the limited scope of the collected data.
- Kernel version: Minimum 6.7 (required for timer functionality to pin timers to cores)
- Hardware: Any x86_64 server with perf counter support
- Resource utilization:
- Memory: ~300MB per node
- CPU: ~1% for eBPF, ~1% userspace
- Storage: ~100MB/hour of collected data (varies with node size; there is a quota configuration option to limit the amount of data collected)
See the benchmark results for more details.
The easiest way to install the collector is using our Helm chart:
helm repo add unvariance https://unvariance.github.io/collector/charts
helm repo update
helm install collector unvariance/collector \
  --set storage.type="s3" \
  --set storage.prefix="memory-collector-metrics-" \
  --set storage.s3.bucket="your-bucket-name" \
  --set storage.s3.region="us-west-2" \
  --set storage.s3.auth.method="iam" \
  --set serviceAccount.annotations."eks\.amazonaws\.com/role-arn"="arn:aws:iam::123456789012:role/S3Access" \
  --set collector.storageQuota="1000000000"
This example shows how to configure the collector with S3 storage using IAM roles for authentication, with a 1GB quota.
For complete configuration options, see the Helm chart documentation.
See the GitHub Actions workflow for detailed build steps.
We're actively working on:
Container Metadata (PR #153
- Capturing container and pod metadata for processes
- Exploring Node Resource Interface (NRI) for metadata access
Noisy Neighbor Detection
- Identifying noisy neighbors from raw 1ms measurements
- Aggregating metrics over longer intervals to determine:
- Which pods are noisy vs. sensitive
- % time each pod is noisy or impacted by noise
- Quantifying cycles wasted due to noise exposure
We welcome contributions! Here's how you can help:
- Code: Check our good first issues and documentation
- Use Cases: Share interference scenarios, test in your environment
- Discussion: Open GitHub issues or reach out - @Jonathan Perry on CNCF Slack
- Schedule a Chat: https://yonch.com/collector
- KubeCon Europe 2025: The Missing Metrics (video) (slides)
- KubeCon NA 2024: Love thy (noisy) neighbor (video) (slides) (notes)
The collector was benchmarked using the OpenTelemetry Demo application.
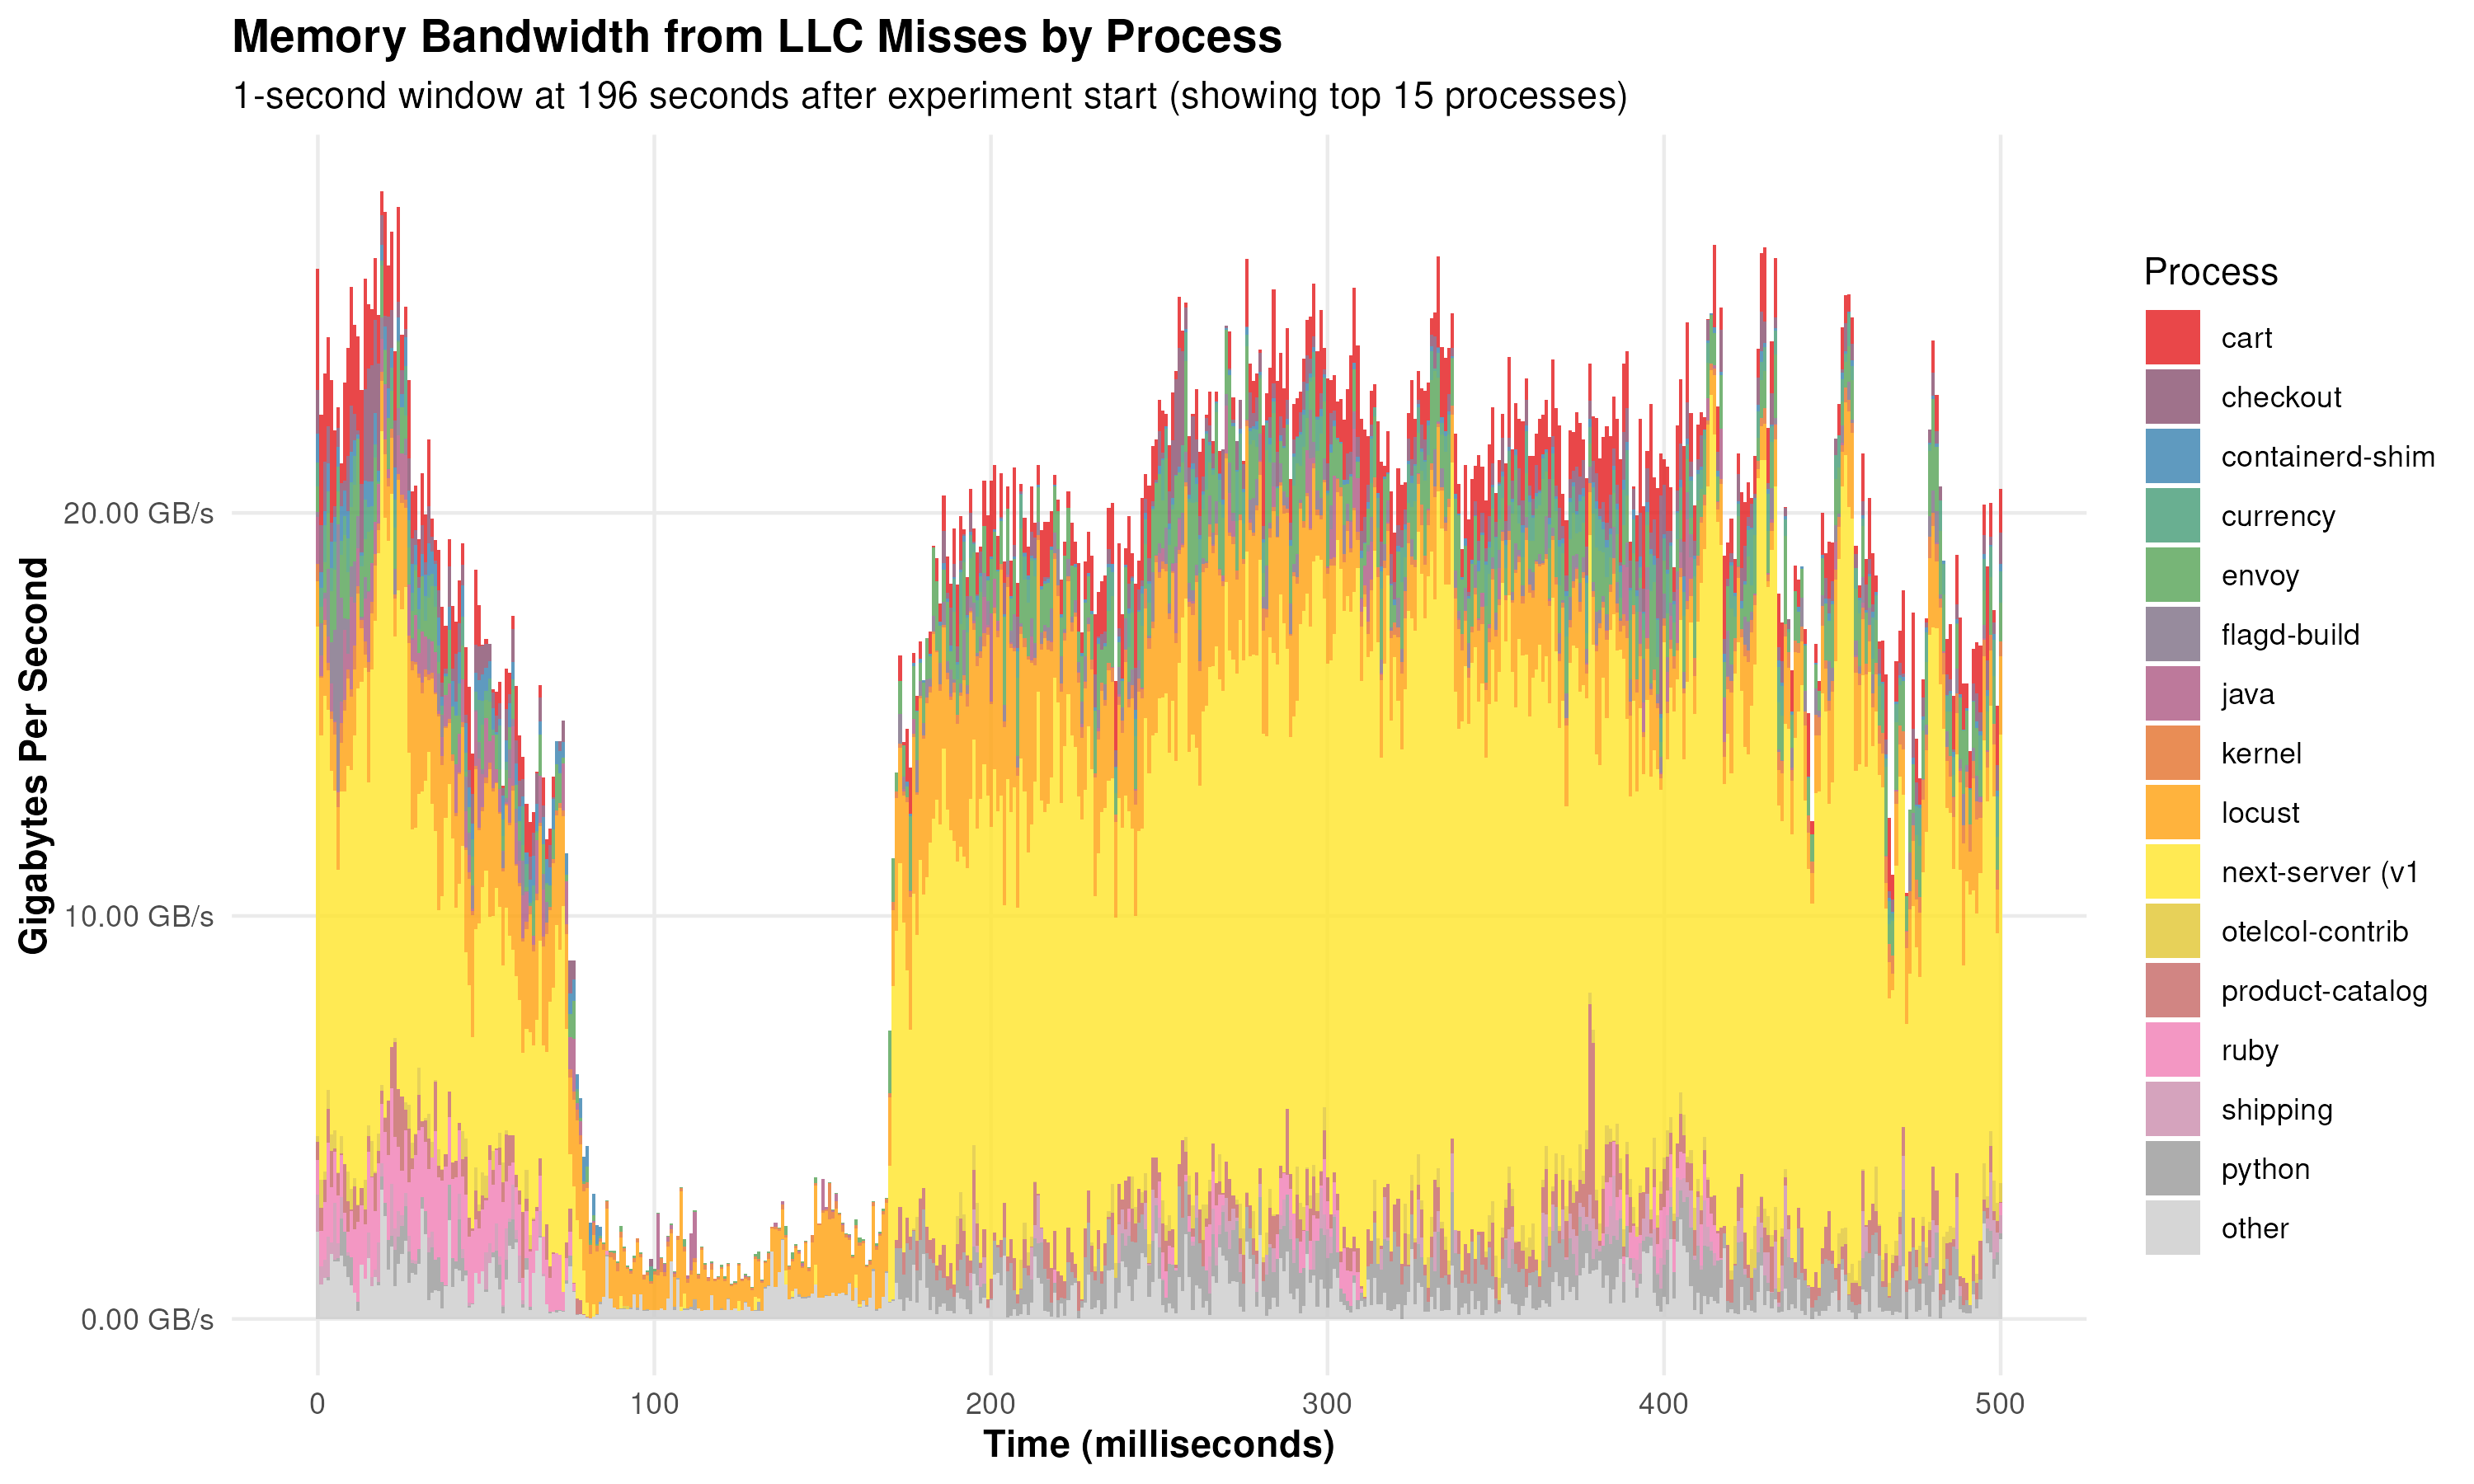
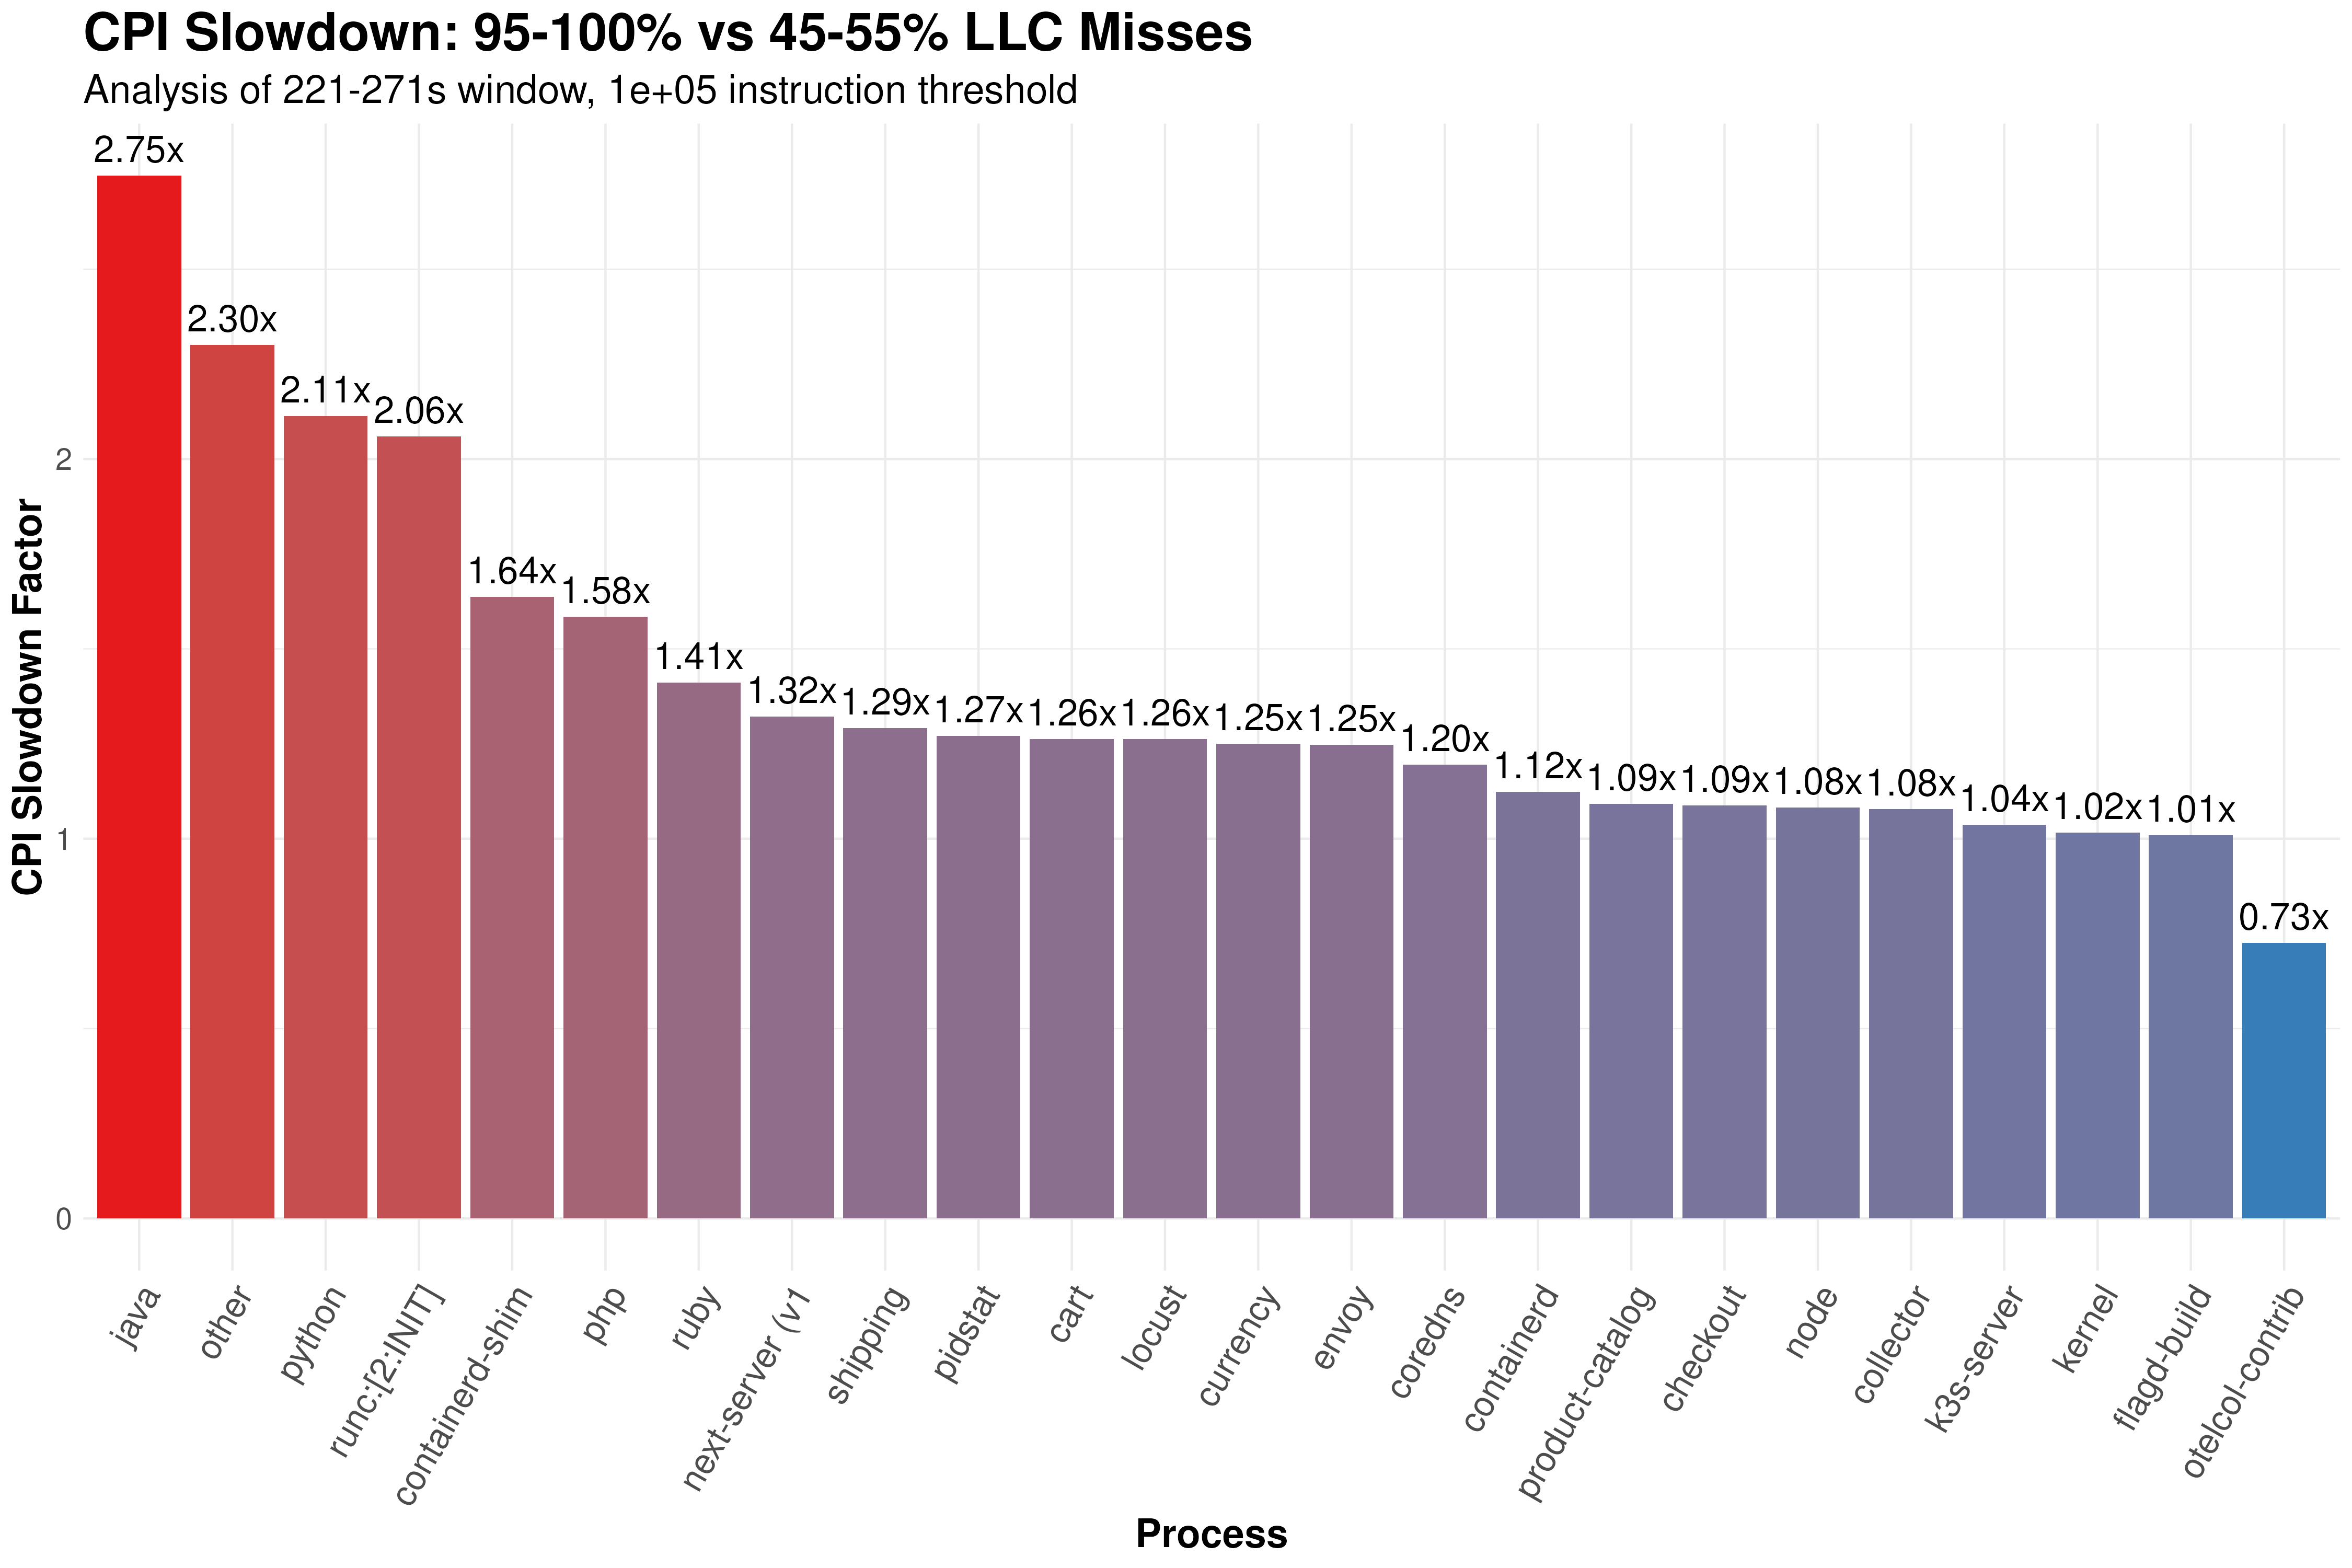
See the benchmark results for more details.
This project builds on research and technologies from:
- Google's CPI² system
- Meta's Resource Control
- Alibaba Cloud's Alita
- MIT's Caladan
Code is licensed under Apache-2.0. Documentation is licensed under CC BY 4.0.